Categories
What Does Facebook Analytics Include?
Facebook analytics is crucial for understanding your social media performance and optimizing strategies. Social Blaze’s Facebook Analytics feature offers in-depth insights for each connected page, allowing you to track key metrics. You can access reports from a unified dashboard, and choose data for the last 7, 15, 30, or 90 days. Moreover, you can not just view but download and email detailed analytics reports of your connected Facebook accounts or pages.
The Social Blaze Facebook Analytics are categorized into two sections:

1. Page Analytics
It shows a comprehensive overview of your Facebook page’s performance, including metrics such as audience growth, impression trends, and most active commentator. These metrics help you understand how well your content is resonating with your audience.
Here are the related metrics that the Page section shows you:
Page Overview
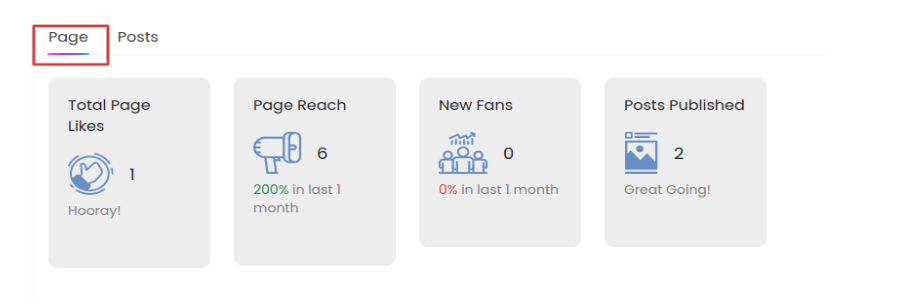
This section comprises elements that give you a general idea of the performance of your Facebook pages, including:
- Total Page Likes: Total count (unique) of likes your FB page has received since the beginning.
- Page Reach: Total number of individuals who viewed content from your page or about your page on their screens.
- New Fans: Total count of people who liked your page in a specific period.
- Posts Published: Total post count you have published in a specific period. The post type could be texts, images, links, polls, videos, etc.

Audience Growth
This metric shows the total number of fans you have gained and lost (likes and unlikes) on a daily basis for the selected period.
Impression Trend
It shows the number of times content from your page appeared on someone’s screen. It separates impressions into organic and paid, giving you a clear view of each source’s impact. In addition, viral impressions reflect the percentage of views your content receives when people engage with it due to their friend’s interactions.

Facebook Insights suggests that viral data shows organic reach. But what is viral reach? Well, it refers to when users engage with your page by liking, following, sharing, or visiting your content can appear on their friends’ feeds.
On the other hand, impression insights display the percentage change in total impressions by comparing data from the selected time to the previous one.
Most Active Commenters
It shows which users have engaged with your page through comments in a specified period.
2. Posts
In the “posts” section, you can get the details of the performance of individual content types. It highlights key metrics like reach, engagement, etc., allowing you to assess which posts are driving the most interactions. This detailed breakdown helps you fine-tune your content strategy for maximum impact.
Here are the related metrics that the Posts section shows you:
Posts Overview
This section shows us a high-level overview of key metrics that showcase your posts’ performance at a glance. It includes the following metrics:
- Posts Published – Represents the total number of posts published within the timeframe you selected for analyzing your performance.
- Posts Reactions – Represents the total likes and reactions your content has received during the chosen time frame.
- Post Reach – The total number of individuals who have seen any content from your page on any screen.
- Post Engagement – Number of people who engaged with your posts through likes, shares, comments, or clicked on your posts during a specific period of time.
- Post Video Views – The total number of views on video posts published within the chosen timeframe.
- Post Shares – The total number of shares your posts received on the platform during the selected time.

Post Type
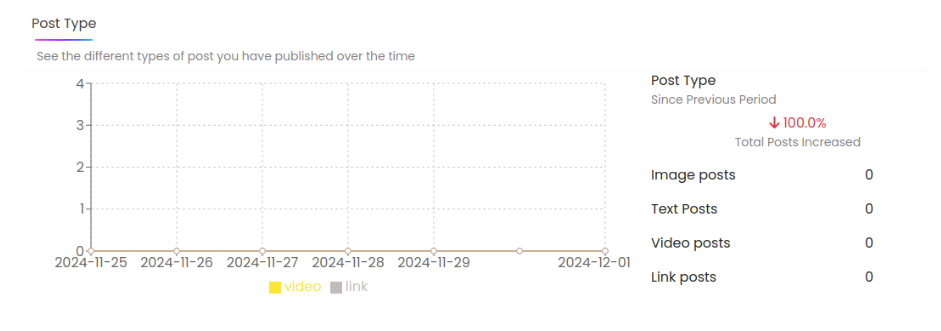
This metric shows the different types of posts, including image, text, video, and link posts that you have published over time. Hovering over a specific point in the graph reveals the exact numbers and percentage breakdown for each post type.

Median Reach And Engagement
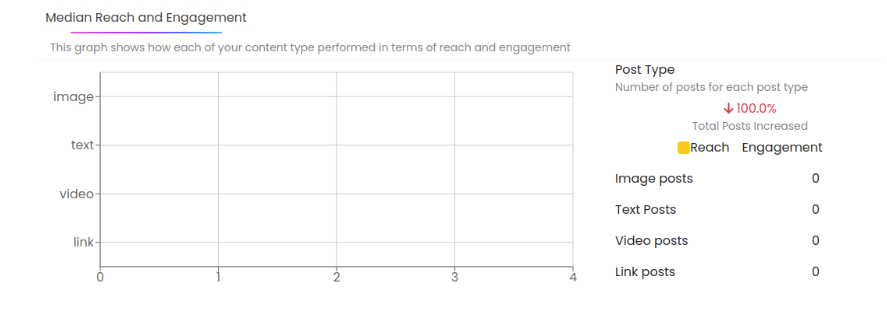
This section compares reach and engagement for each content type, using medians to highlight which content resonates most with your target audience. It also shows percentage changes to guide content strategy adjustments.

Post Performance
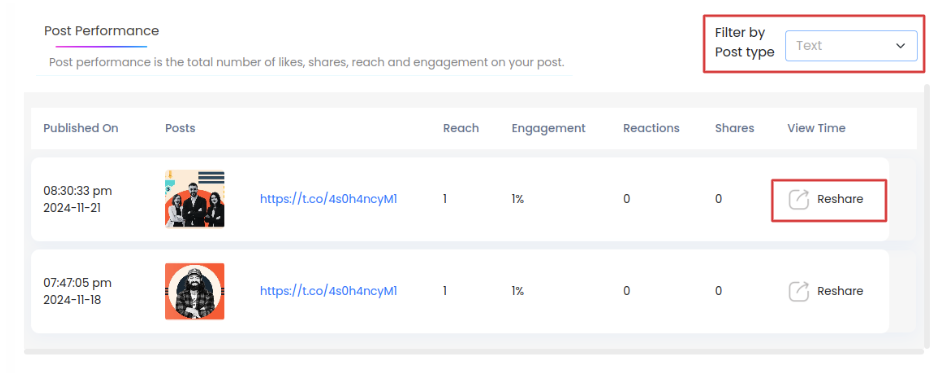
This section shows a detailed assessment of the performance of your posts, including reach, engagement rates, reactions, shares, and video view times for individual posts. It calculates the engagement rate based on interactions as a percentage of total viewers. You can also sort posts by type and reshare top-performing posts directly from the analytics dashboard to save time and boost engagement.

Popular Hashtags
This section gives you an overview of the most popular hashtags you have used in your posts.