Categories
What Does Instagram Analytics Include?
Social Blaze allows you to monitor all your connected Instagram (IG) accounts and create detailed reports to help you understand their performance. It includes metrics such as target audience and how they interact with your posts on Instagram. These Instagram analytics help you refine your Instagram marketing strategies.
With our Social Blaze Instagram analytics feature, you can view, download, email, and even schedule the analytics reports of your connected IG accounts. You can get the analytics of your IG accounts for the four different categories:
Let’s get into the details of each one by one.
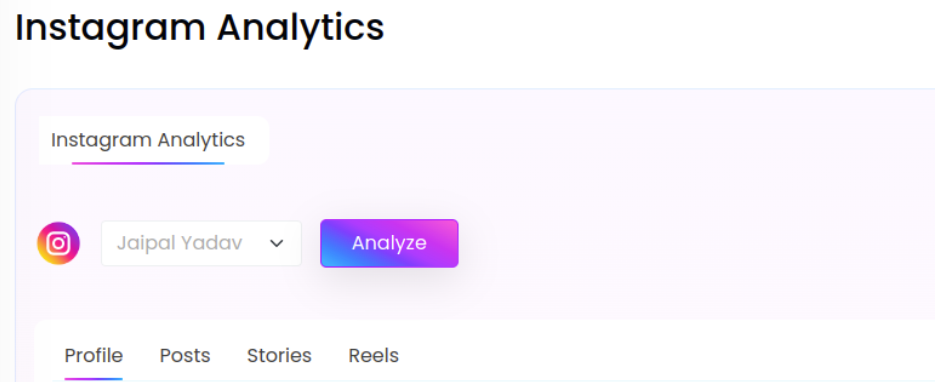
1. How To Check Instagram Profile Analytics in Social Blaze?
The profile section gives you an overview of the basic engagement metrics your IG profile received in the chosen time frame.
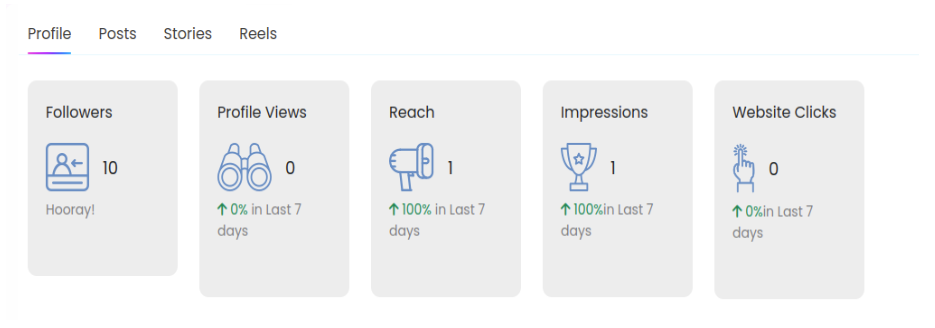
Here are five metrics that you can analyze your IG profile for:
- Followers: Shows the total number of followers your Instagram page have.
- Profile Views: Represents the total count of visitors who visited your IG profile during the chosen time frame.
- Reach: This metric reflects the total count of unique users who have viewed any content from your IG profile within the chosen time frame. It doesn’t include repeated views by the same individual.
- Impressions: the total number of times your IG content was displayed on the screens of other users during the selected timeframe.
- Website Clicks: This shows the number of times users have tapped on the website link in your profile for a selected period.
All the metrics under the Profile section, except for “Followers” show the percentage change compared to the previous time period.
New Followers
It enables you to discover the number of new followers that you have gained since the last period. It shows a graph of new followers on a specific date.

2. How To Check Instagram Post Analytics in Social Blaze?
This section shows the basic engagement metrics of your IG posts during the selected time period.
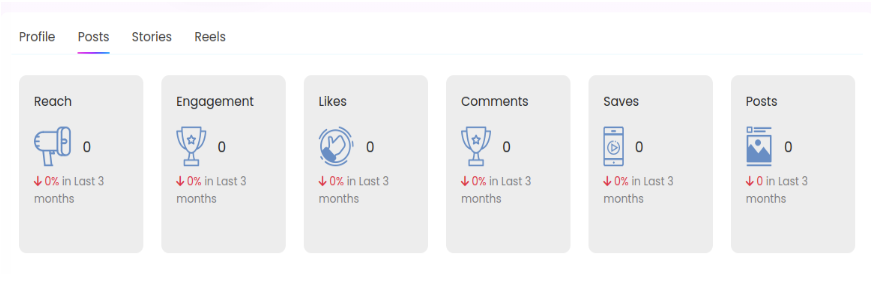
- Reach: It shows the total number of unique users who have viewed your IG posts (photos, videos, and carousels) at least once during the chosen period.
- Engagement: The total likes, comments, and saves on all your photos, videos, and carousel posts during the selected time for video analytics.
- Likes: The number of likes on your posts published during the specified period.
- Comments: Total comments made on your posts that were published within the period in question.
- Saves: The number of posts saved by the audience within the given timeframe.
- Posts: The total number of posts published during the selected timeframe for viewing analytics.
Reach
The Reach section shows how many unique people saw your posts and helps you determine the best days to publish posts for better reach. It also shows the percentage change and total reach against the previous time.
Post Engagement
In this section, you can see a graph showing likes, comments, and saves during a specific time. It also shows how many times people engaged, and if there was a change in engagement compared to the previous period.
Post Performance
The Post-performance section has data on post details including date, caption, type, comments, reach, impressions, saves, engagement rate, and the ability to re-share top posts directly.
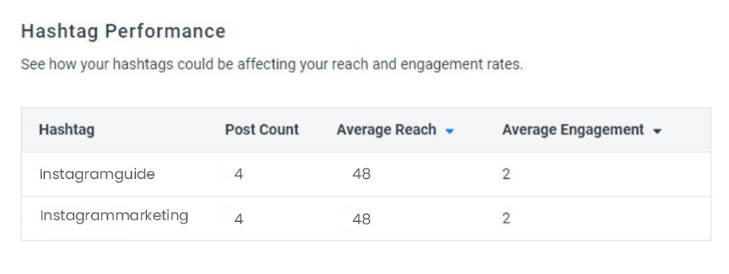
Hashtags
This section ranks your top hashtags based on their average reach, engagement, and usage frequency in posts.
How To Check Instagram Stories Analytics in Social Blaze?
This section shows analytics for stories for 24 hours. Once the story disappears from your IG page, the analytics will also be gone.
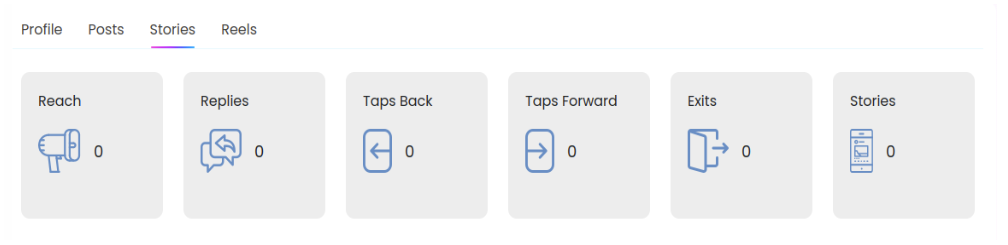
Here are five metrics that you can analyze your IG Stories for:
- Reach – Total count of unique people who saw your Stories.
- Replies – Total number of replies to your stories.
- Taps Forward – The number of times people tapped to see the next photos or videos in your stories.
- Exits – Total counts when people swiped out of your stories before they ended.
- Stories – Number of stories you posted in the past 24 hours.
Stories Performance
Here, interactions with your stories, such as Replies, Taps back, Taps forward, and Exits show up in this bar graph over the past 24 hours.
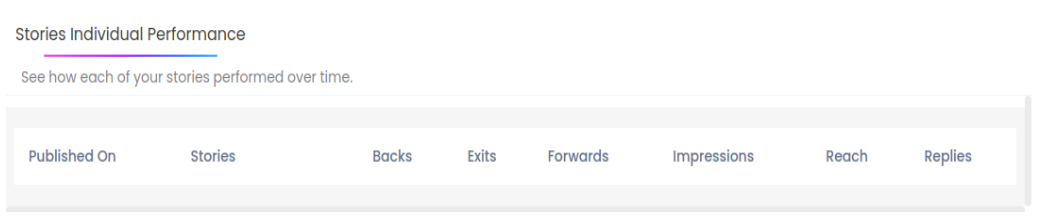
Stories Individual Performance
This section has plenty of information to evaluate your individual story’s performance. You can see different data shown in the screenshots below for all the stories you have published in the last 24 hours.
How To Check Instagram Reels Analytics in Social Blaze?
The reels section in the Instagram analytics feature provides you with insights about your published reels, including their reach, interactions, and performance during the selected time frame.
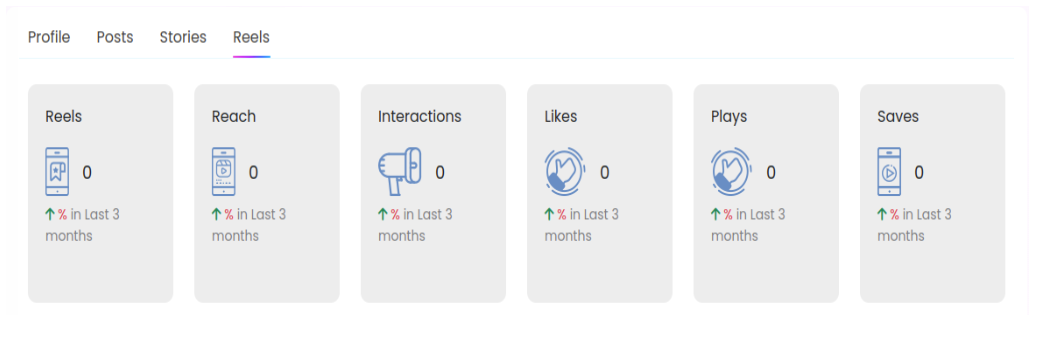
Here are the six metrics that you can analyze your IG Reels for:
- Reels – Total count of reels posted on the IG account in the selected period.
- Reach – The unique number of people who viewed your reels.
- Interactions – Engagement on your reels, including likes, shares, comments, and saves.
- Likes – Number of likes on all your reels posted within the selected period.
- Plays – Total number of times your reels were played.
- Saves – The number of unique accounts that have saved your reels.
Reach
In this section, you’ll see an exact viewer count along with the trend for your reel, reach number, and percentage change compared to the previous period.
Interactions
The section graphically represents viewer interactions, like comments, shares, and saves over time, highlighting the highest engagement day and current interaction changes in percentage.
Hashtag Performance
In this section, you can see the popular hashtags, their average reach, interactions, and the number of reels using each hashtag.